The Art of Debugging in Python
A Guide to Squashing Bugs Efficiently

→ What and Why?
As you venture deeper into the realm of Python, encountering bugs in your code is inevitable. However, the difference between a frustrating coding session and a productive one often lies in how you approach debugging.But you might be asking what to do when you encounter a problem? Should you just think re-re-read the code? As | John Carmack said (in | this podcast)
Anybody that thinks just read the code and think about it... that's an insane statement. You can't even read all the code on big systems [...].And he is right. Debugging is not just about fixing errors, it is also about understanding your code better by going line by line through it. In this article, we'll explore some tools you can use to make debugging in Python not only effective but also (((somewhat))) enjoyable.
→ Get an idea of where the problem is.
Simplify and Isolate
When Python encounters an error, it throws an exception and prints a stack trace, which is essentially a map that shows you where things went wrong. Initially, stack traces might seem daunting with their cryptic messages and lines of code. However, learning to decipher stack traces is like learning to read a treasure map. Start from the bottom and trace your way back to the line in your code where the error originated.Understand the Stack Trace
When faced with a complex bug, the best strategy is often to simplify and isolate. Try to replicate the issue in a smaller, controlled environment. This could mean writing a simpler version of your function or script that only focuses on the problematic part.By isolating the bug, you not only make it easier to understand and fix but also minimize the variables and interactions that could be contributing to the problem.
→ Print, a basic way to Shed some light.
Good ol' print statement
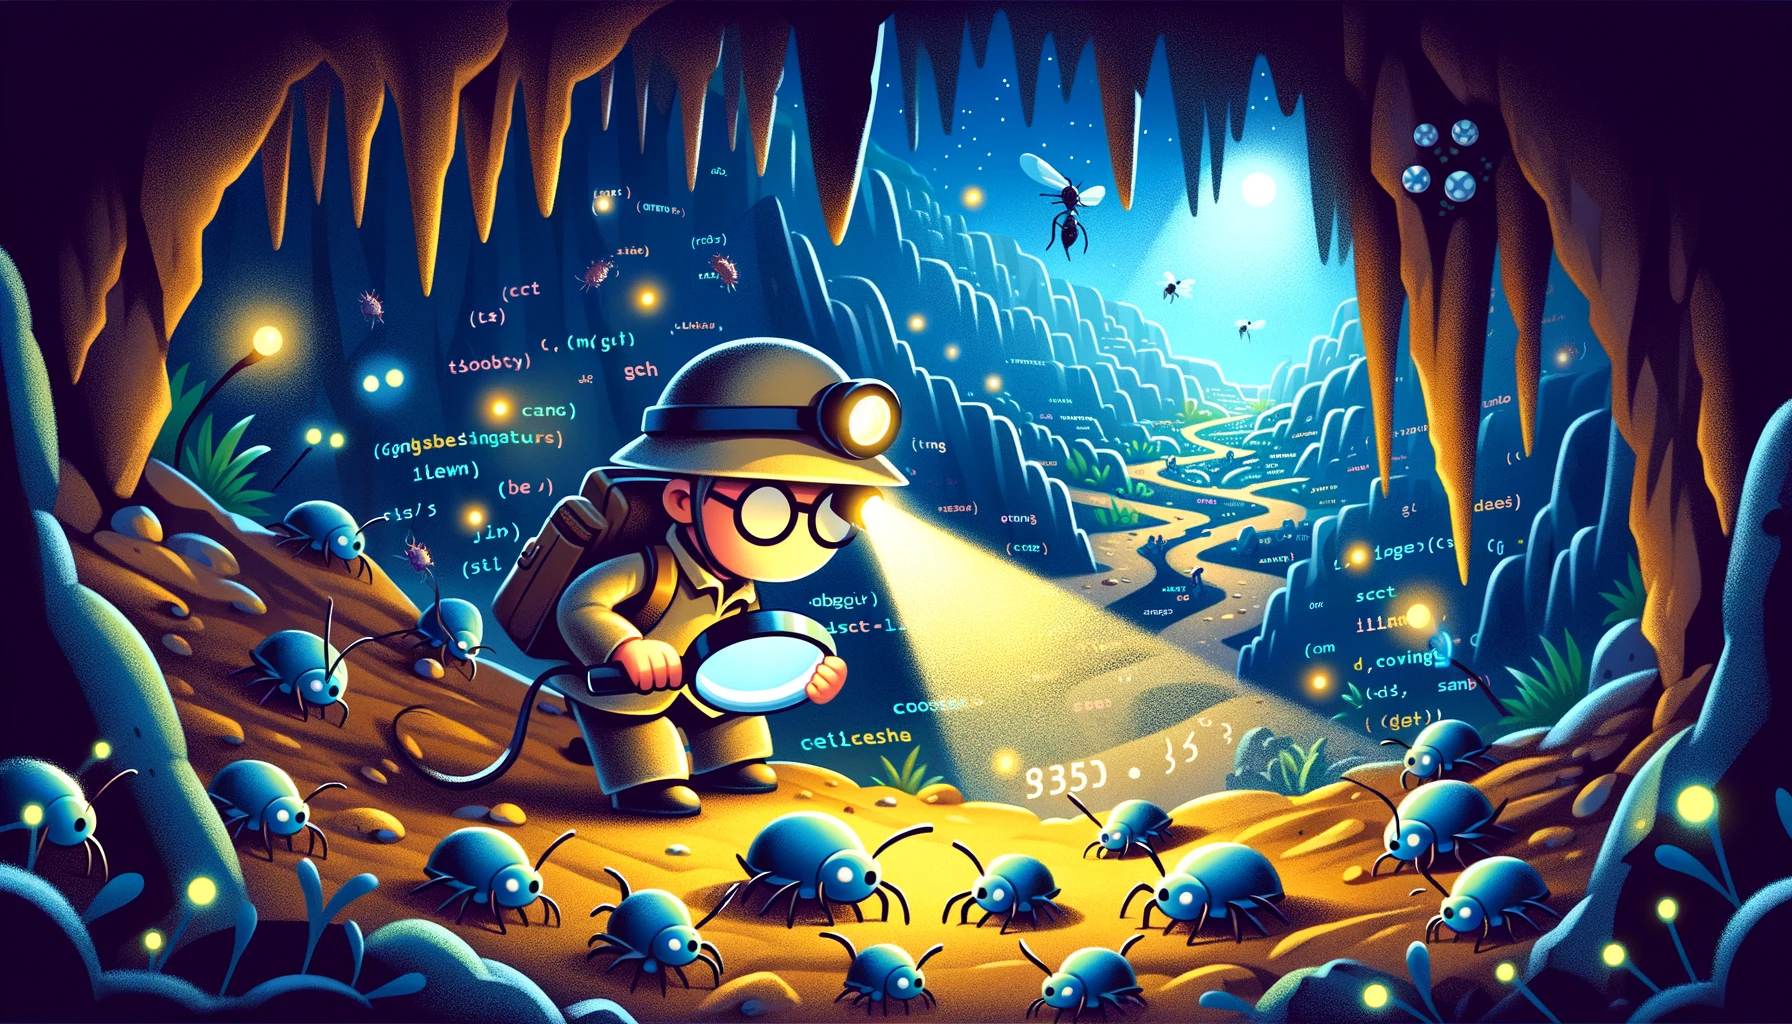
In all honesty, most of your quick debugging might be simply a print statement. While print statements can sometimes help you trace the flow of your program, relying solely on them is like navigating a dark cave with a flickering torch. You won't see much and if you are not lucky you will miss what you were looking for...A better print
A replacement for print would be pprint. Pprint is the | the data pretty printer, in our analogy it would be a slightly better torch but still flickering! It just makes the output easier to understand (useful for long JSON objects).→ PDB, the better approach
What is a debugger
tldr; A debugger is how you get a view into a system that's too complicated to understand.A debugger is a tool that helps to identify and fix bugs. It allows you to inspect variables, step through code line by line, set breakpoints to halt execution at certain points, and evaluate the program's state at various stages. We use it to understand how the program operates and where it deviates from expected behavior.
PDB or Python DeBugger
Python's built-in debugger ( | PDB) is a powerful tool that allows you to pause execution, inspect variables, and step through your code line by line. Familiarize yourself with pdb commands such as break, continue, list, and step. By mastering pdb, you turn the lights on in the cave, giving you a clear path to the source of the bug.→ Conclusion
Debugging is an essential skill for any Python programmer, and like everything else, it requires practice, patience, and a bit of creativity.And remember, coding is also solving bugs. And each bug you squash not only makes your code better but also makes you a more skilled and resilient programmer.
